
8A: Infographics Project

Client Situation
You have been gathering data on a trending topic assigned by your project manager. Now, you will create any type of infographic to be shared on Pinterest as well as the company’s blog.
Preparation
- READING: What Makes A Good Infographics, The Do’s and Don’ts of Infographic Design
- VIEW: 8A Sample Blog Post
- TOOLS: Adobe Illustrator
- GOOGLE IT: It is always good to research existing designs. This will help inspire you and direct your own design. Take time to review the 8 infographic categories on this page. Think about topics you are passionate about or enjoy as you are looking around for examples. Decide on a general topic that you would want to gather some data on.
- OTHER RESOURCES: Color Scheme Resources: Adobe Kuler, Design Seeds
- The 8 categories of infographic:
• How-to
• Research Results
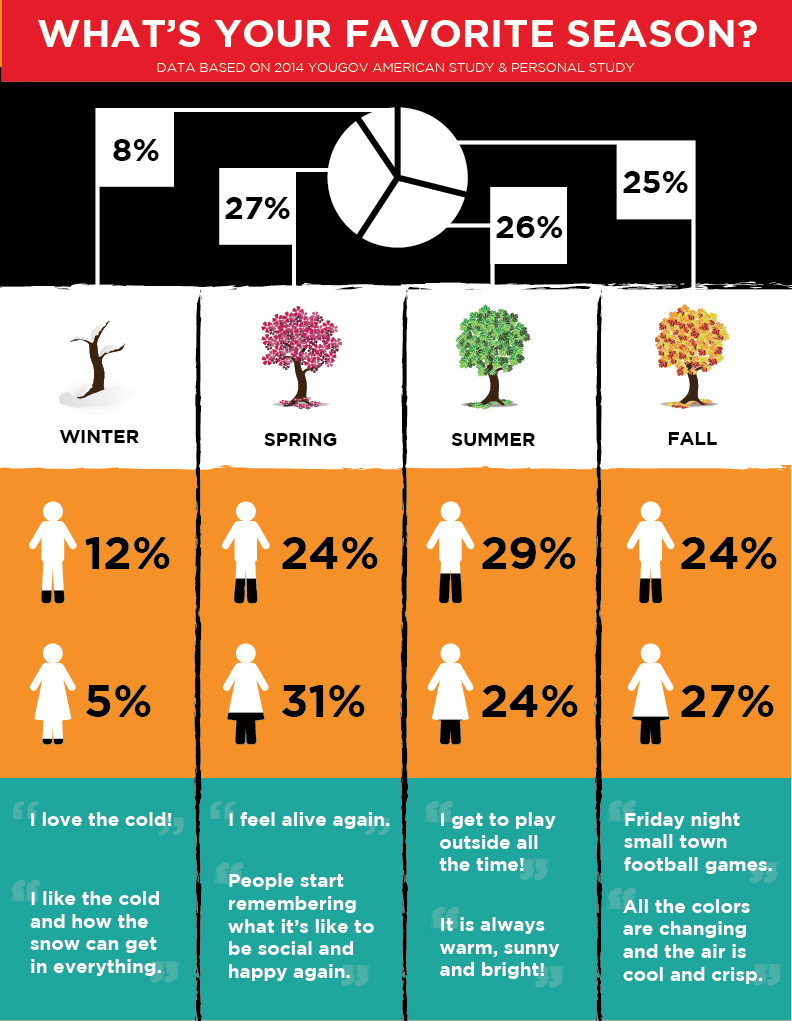
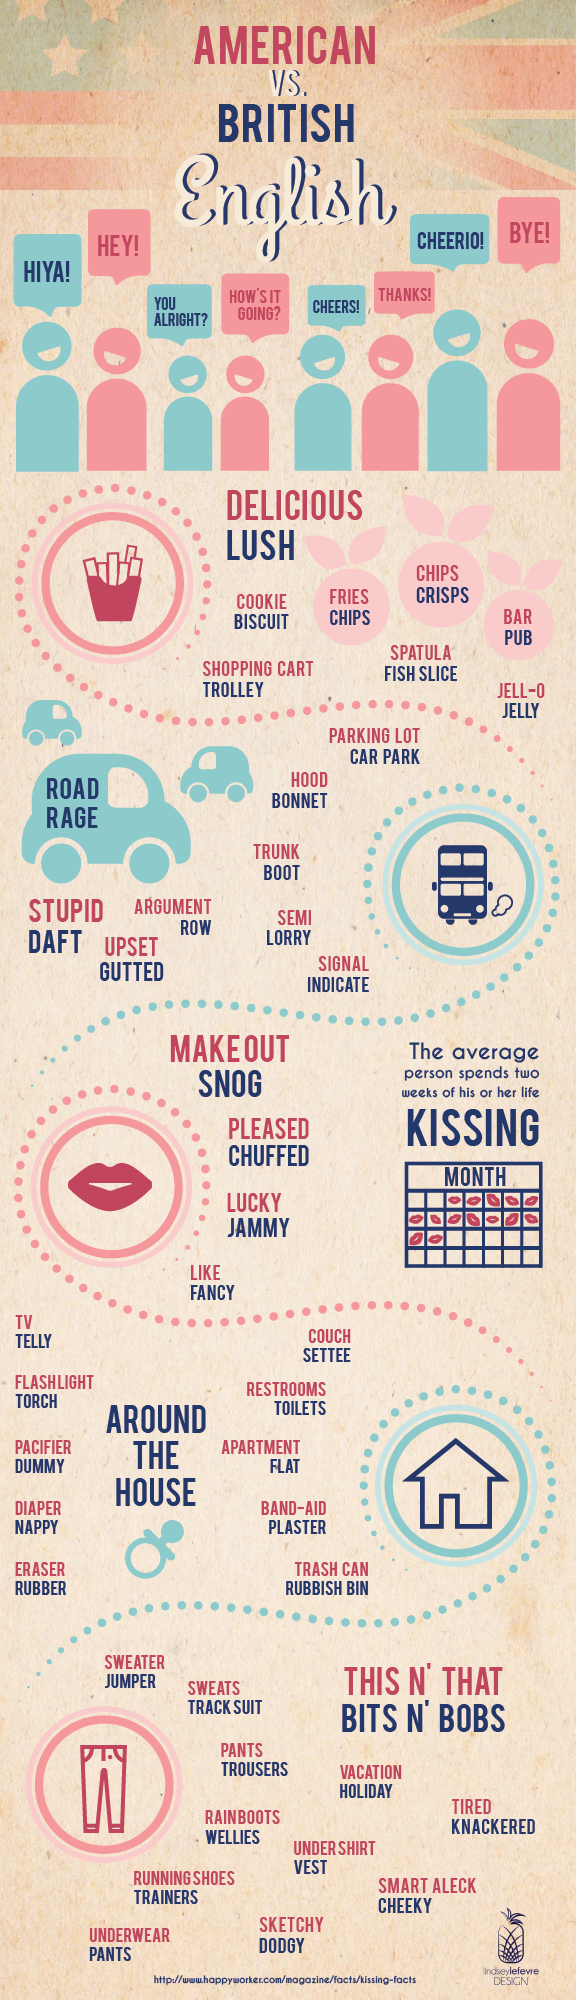
• Compare & Contrast
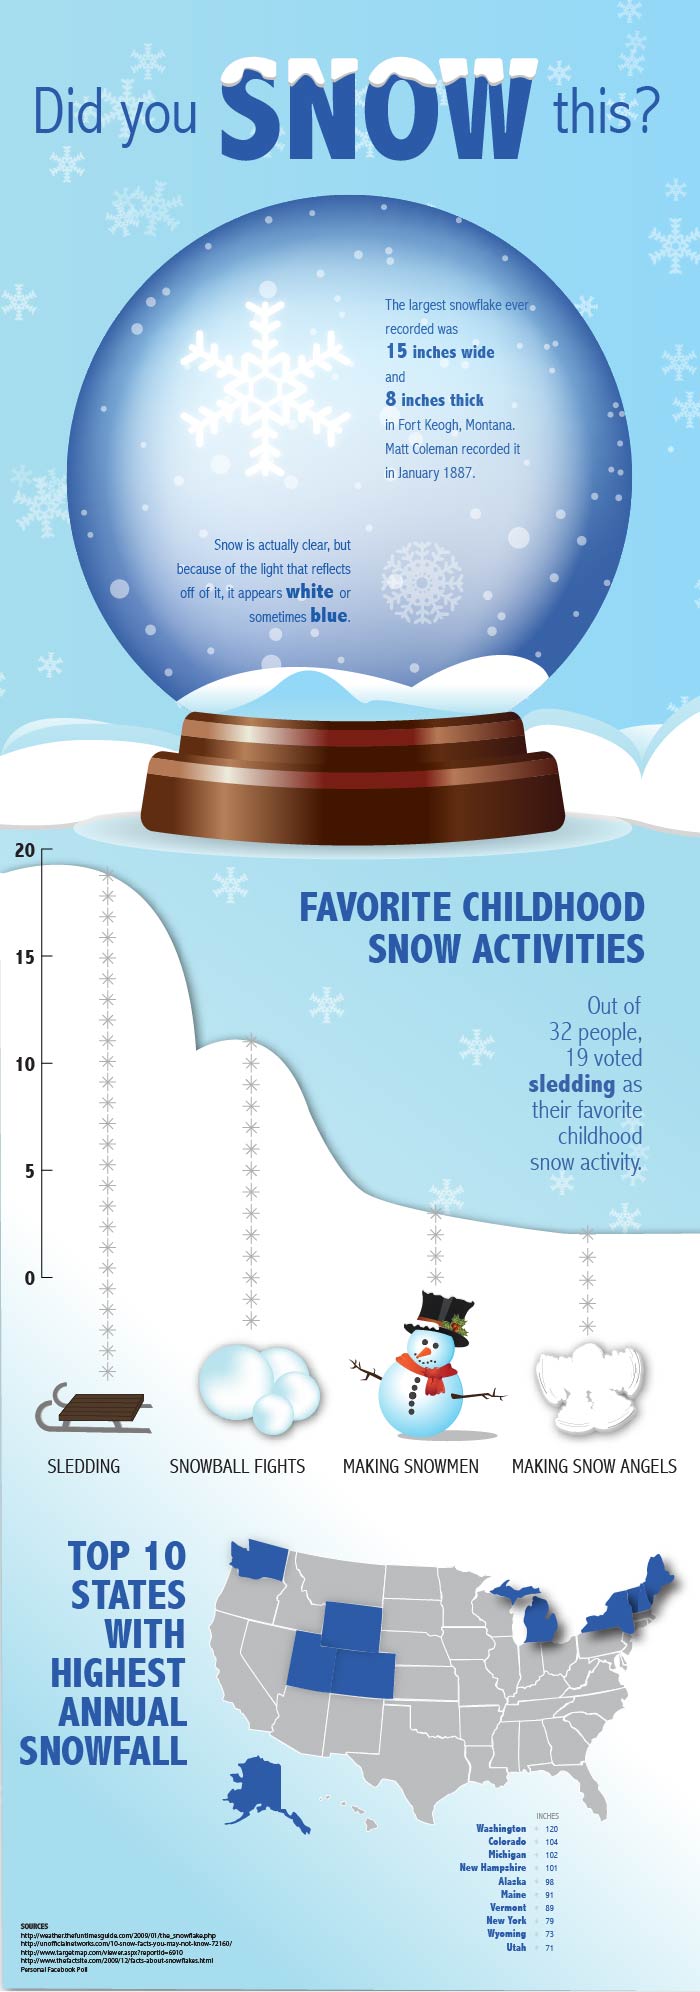
• Did You Know
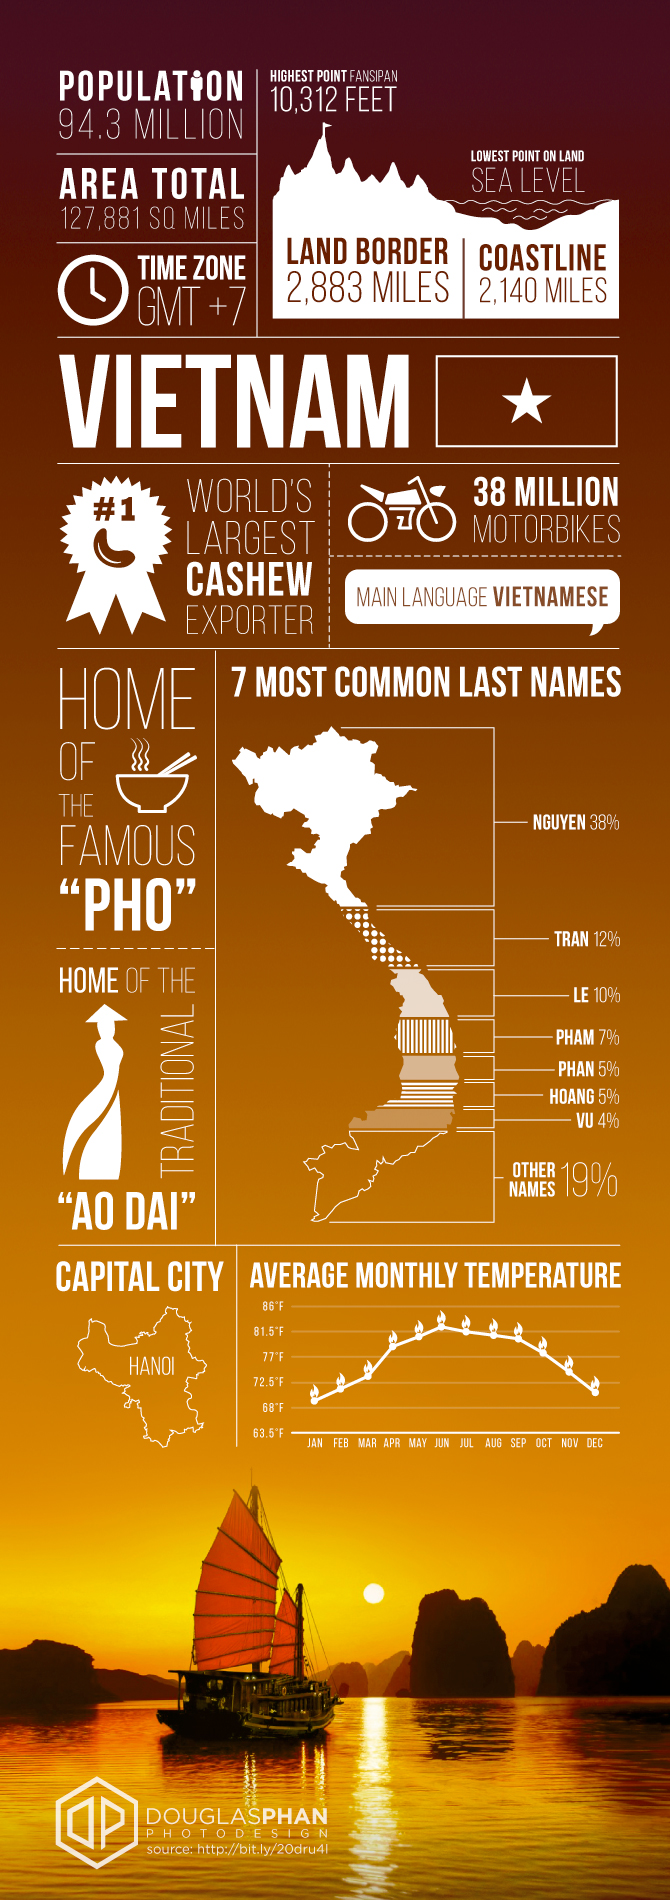
• Demographic
• Advocacy
• Timeline
• Tips & Demos
Instructions
You already Formulated a Plan during the activity leading to this project. You chose a topic, gathered some data, created a plan and made some sketches. Now it is time to complete the project in Illustrator, gather critique, refine your project, then complete and publish and submit your project to your “client” (in this case, your instructor.)
Use the plan and sketches you created in the preceding activity to finish your Infographics project.
1. CREATE AN INFOGRAPHIC BACKGROUND
Decide what type of background (texture, solid color, gradient, sections, etc) would fit with your topic. Avoid having a plain white background for your infographic, but you could have white blocks as portions of your background.
2. CREATE GRAPHICS/ICONS
Take some time to vectorize your sketched graphics using Adobe Illustrator (live trace is NOT allowed). Place them on the background to start creating a flow and to ensure they are unified. You are required to have at least 4 graphics/icons in your infographic.
3. GRAPH & CHART
Graphs and charts can be very helpful in conveying information, but they can also be very dull. As a visual communicator, your job is to creatively convey the information. Think about your data and what you are trying to display. How could you make the graph/chart look more relevant and interesting? For example, do you have data about the number of tweets per second? Try making the graph look like an odometer? A little creativity will get more people to stop and internalize your message.
You want to make sure that your graphs or charts are to scale. There is no reason that you can’t achieve this. Illustrator, and other tools, make it easy to create simple graphs/charts. After creating the basic chart you can then ungroup it and manipulate it. Illustrator makes it easy to create simple graphs/charts. Here is a tutorial that shows you how you can manipulate a simple bar graph. (This tutorial shows you how to create a 3d graph, but will give you an understanding of how to create and manipulate a graph or chart in Illustrator. Please don’t make a graph or chart 3d, unless you intend to make all your charts or graphs 3d.)
Caution: Graphs and charts that sit next to each other with different scales and skewed perspectives can distort the data and the perception of your viewer. This is dishonest and should be avoided.
4. ADD YOUR LOGO/TRADEMARK & SOURCES
Add a logo that you created (if applicable) in your infographic as well as the references to your sources.
5. BLOG POST & SUBMISSION
View 8A Sample Blog Post as a guide.
Submission – Find more details in Course > Blog Post: Submission Instructions
1. Go to project submission and attach the SCREENSHOT of your blog post.
2. Then you will be able to insert a working HYPERLINK to your blog, in the comments box.
3. State if you “attended class” by watching the entire INTRO/DEMO VIDEO and list the KEY WORDS.
Rubric: (30 points)
NOTE: Meeting these minimum requirements will result in a 80% or B- grade, according to the University Grading System. To receive a higher grade, students must exceed these minimum expectations.
√ Design Principles
• Message: Clear message • Audience appeal/relevance
• Proximity: Adequate white space/grouped white space/not trapped • Proximity Grouping/adequate spacing
• Contrast: Draws eye/focus • Hierarchy • Avoid conflict
• Repetition: Repetition (elements repeat) • Unity
• Alignment: Avoid centering • Placed with purpose • Creates relationships
• Good Design, Creativity and Uniqueness, and Shows Effort
√ Typography
• No more than 2 fonts • Contrasting fonts • Title size/font contrast • Appropriate leading/kerning/tracking • Easy to read • Text spacing in box • Text not too close to edges of page or other elements • Proportional text (not squished or stretched)
• Small body copy (10-12pt) • No widows • No orphans • No underlining • No hyphens • Consistent paragraph alignment/Indenting
• Appropriate caps • Correct spelling / punctuation / grammar
√ Color Scheme
• Color Swatches part of design • Swatches labeled with color names from the color wheel • Color Scheme title included in layout • Accurate colors used from the chosen Color Scheme • Accurate color matching from image • Use each color in Color Scheme at least once in the layout in addition to the color swatches.
√ Graphics/Graphs
• Cohesive • Unify • 1+ Graph • 4+ Graphics/Icons
√ Blog Post & Submission
• Blog Post: Project at large size • Description • Well-written process (Programs/tools/skills/design principles) • Critique Report • Message • Audience listed • Top thing learned • Colors scheme and color names listed • Title/Copy font & category listed • Thumbnail of original, unedited image inserted • Date and location you took the photo(s) • Link to blog post • Screenshot of completed full blog post • Class Participation & Keywords
CAUTION: your assignment is not complete until you submit in I-Learn. However, you are allowed a one-time extension, if you choose to use your mulligan. (See syllabus). We check your blog post for completion right at the deadline, so please do not add things after submitting your link, until it has been graded.